Analytics and Reporting
Measuring Performance, Planning for Action
What's Being Measured?
One of the world’s foremost management gurus, Peter Drucker, had a famous quote “What gets measured, gets done.” Our vision for web analytics is much the same. When properly used, website analytics can be used to understand how users interact with and use web pages. We look beyond click through rates and vague concepts; we’re looking for engagement that results from participation in the site and how that drives value.
Whether your website is driven by content, products, mission, or cause-related action, understanding precisely how visitors interact with the site can be helpful to determine what changes should be considered.

Custom Reports and Dashboards
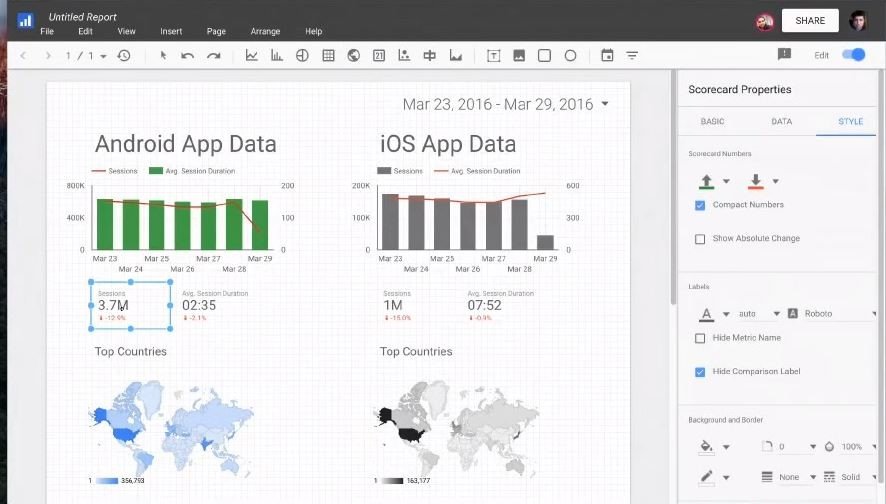
Custom Reports
We provide custom reports that show precise detail for your web performance. How many sessions converted to sales this month versus last month? How does a competitor's ad effect our online sales this week? Do your visitors tend to gravitate toward interactions in Chat or through forms?
Dashboards
Benchmarking and measuring outcomes are great - but the key data is often hidden deep inside reports that are painstaking to review. BI Dashbards will give you snapshots of key metrics, allowing you to see precisely what data drives your economic engines and where the indicators are for action.
Get Answers Faster
Get the answers you need to the challenging questions you face. Fast. Simple. Now. Contact us today and get more information about Custom Reports and Dashboards for your small business
Case Study
We had a client who planned a major traditional billboard media purchase in several cities in Pennsylvania to help increase awareness and demand for their product. Before they made the media buy, we analyzed the web analytics and discovered users from one city were already representing a large proportion of web traffic. With this deeper information, our client changed their campaign to focus a different marketing effort where “awareness” was already strong.
Improve Your Website with These Statistics
Our web designers have worked on hundreds of web projects over the years, and have seen lots of trends come and go. Design inspirations are based on our experience, evidence from aggregate web users, and proven technologies that form a foundation for success. Our team specializes in:
1. 48% of people cited a website’s design as the number one factor in deciding the credibility of a business
2. 94% of people cited poor web design as the reason they mistrusted or rejected a website
3. 72% of people entrusted online reviews just as much as personal recommendations
4. 40% of people leave a website if it took more than 3 seconds to load
5. 44% of mobile users reported that navigating a web page was difficult and 6% complained of difficulties interacting with it
6. 62% of companies which designed their website(s) for mobile platforms increased their sales
7. Colors increased web recognition by 80%. Sites with dark color schemes increased growth by 2% whereas sites with lighter color schemes experienced 1.3% growth
8. 70% of people looked at lists with bullet points. 55% looked at lists without bullet points
9. 67% of shoppers were more likely to buy from a website that is compatible with mobile devices
10. 27% of sites use HTML. Those sites account for 49% of page views
(source: http://www.ironpaper.com/webintel/articles/10-web-design-statistics/#.U6HOvZRdWSo )